Our Market Space
We are experts in project management, and we are experts at turning your project management data into powerful Power BI reports. And we can make this happen with the press of the button. Furthermore, we have experience across industries and deep domain knowledge in some such as Life Sciences.
Our clients spend a lot of time and effort building out their project portfolios into a tool that enables them to easily plan and track their projects. With Power BI, we can help them make it easy to turn that data into outstandingly useful portfolio reports.
Our Reporting Capabilities Apply to All Project Management Products
Our project management process knowledge and report building capabilities extend beyond any one specific PM tool so we can use Power BI to report from a broad spectrum of tools. We just need the capability to extract the data using one of Power BI’s extensive set of data source connectors. For Instance, Microsoft Excel extracts will do and a wide range of products support these.
Life Sciences Generic Business Case Reporting Example
Let’s consider a Life Sciences program portfolio that our fictitious client has spent a lot of time and effort to put into a project management tool so they can easily plan and track their medicinal development pipeline’s road to commercialization.
Moreover, WGA has extensively used Microsoft Project, so let’s assume the development pipeline portfolio is in Microsoft Project into Power BI. In this scenario, the client portfolio view may look like this in Project Online (PWA).
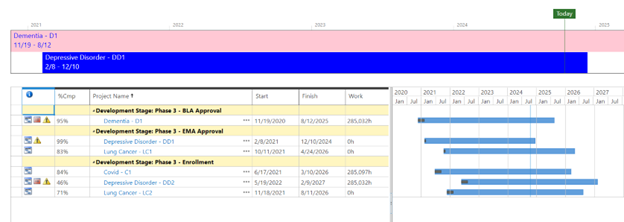
The detailed plans are vital in the biotech development process so in our system we represent each program by a detailed Microsoft Project schedule. Thus, planning and tracking of the discrete work going on across the teams can be easily managed as shown in the sample schedule here.
Portfolio Visuals
Power BI Timeline
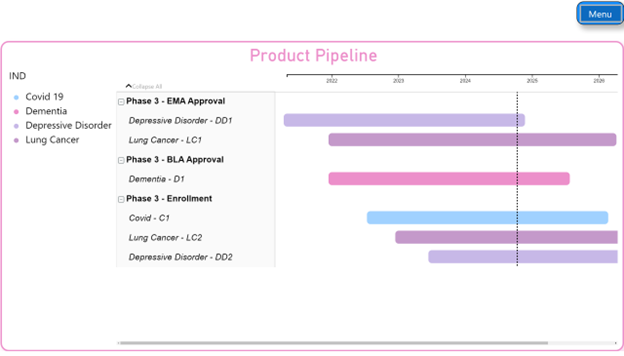
Now they ask us to help them make it easy to generate their stakeholder reports. These two Microsoft products work seamlessly together so it is easy for us to invoke a connector to pull the Project Online data into a Power BI data model. And once there the Biotechnology client would want a 50,000 foot pipeline program view so our first report is a timeline view like this one shown in Power BI. In Power BI it is easy to organize programs by various dimensions such as indication and commercialization phase as we see here.
Pipeline Metrics Dashboard
The pipeline programs have key metrics that should be frequently reported to demonstrate progress through the commercialization life cycle. This example shows progress on regulatory filings and clinical trials. We are experts at generating dashboard visuals like this.

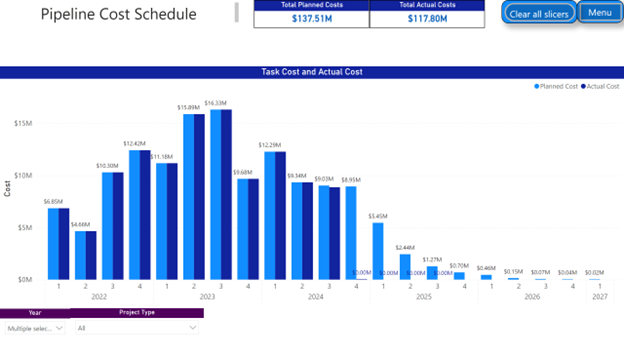
Pipeline Portfolio Costs
Cost information is critical to accurately plan and track in the financially intensive therapy development process. The analytic capabilities of Power BI can easily help you achieve this, and we know how to get your cost information and present it to your financial stakeholders at the level they need it at.
The following report is needed by finance departments to assess forecasts and actual costs at a portfolio macro level. We have the expertise to pull this data from your project management system or your ERP and present it in this easy to use time-phased column chart.
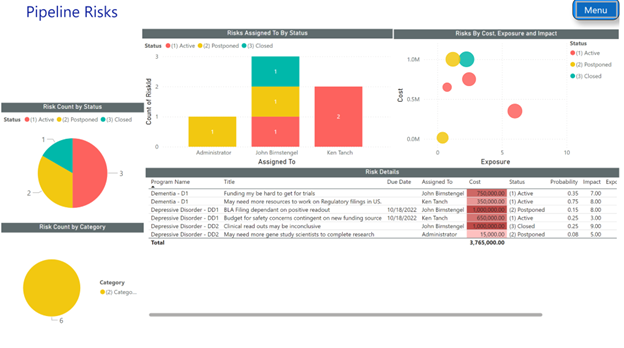
Pipeline Risks
Every program progresses unevenly as seen and unforeseen events come up that obstruct progress. To deal with this situationally, it is imperative to be able to easily present known risks to project stakeholders so they can plan for and react to them as optimally as possible.
Our expertise at risk management reporting is displayed on the following analytical report of pipeline portfolio risks. Key metrics including status, priority, assignee and cost for these are tracked and reported in the graphical visuals on this page.
Program Visuals
The visuals above provide an overall assessment of the pipeline at large, but it critical to delve into the details of each program too. In the Power BI visuals below, we provide insights into how each program is doing on its own.
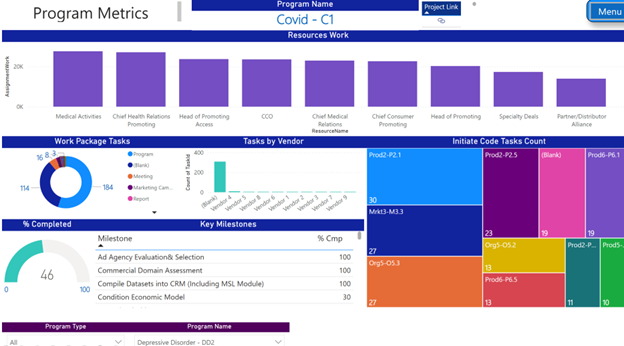
Program Metrics
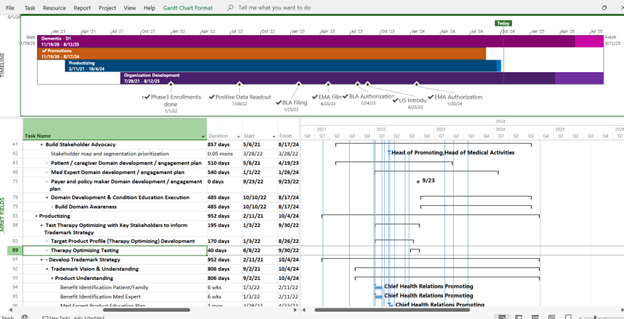
This first visual provides an overall assessment of a program by reporting on detailed schedule metrics like assignments work, task work package types, vendor tasks, tasks by Initiate code, key milestones, and % complete. The important idea here is that any of your own lifecycle, market, functional, or medicinal codes can be set up in the schedule and reported in easily understandable visuals in Power BI.
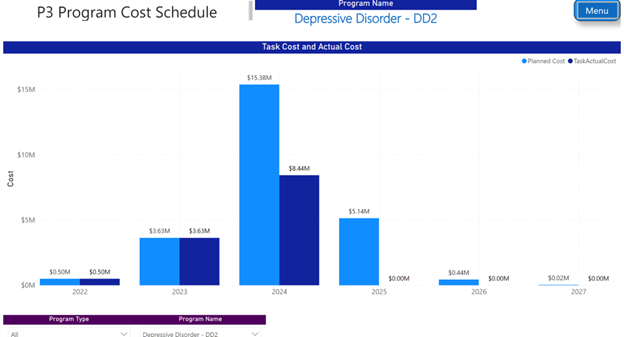
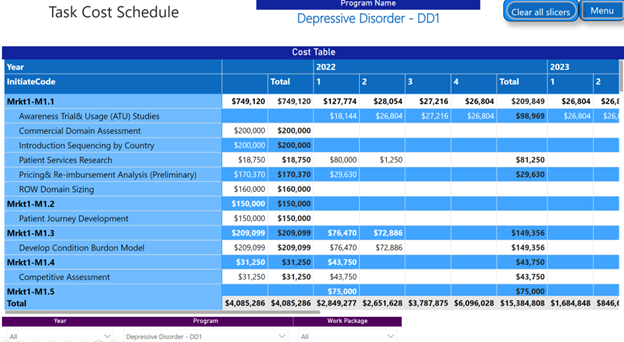
Project Costs Chart and Table
Detailed costs can be tracked in the MS Project schedule and similar to the portfolio level can be reported out in a time-phased fashion so a client’s Finance organization can easily assess the cost implications of each program. The following pages show costs over time in a column chart and in a Excel exportable table.
Resource Management Reporting
Managing the demand for resources is a critical component to project and portfolio management. The key questions, as we look across the pipeline portfolio, are many including:
- What task assignments do our groups and staff have and when are they occurring?
- Do we have enough resource bandwidth to cover the programs we are launching and executing?
- When is the bandwidth needed?
- When are we overloaded?
- Which programs are involved.
- Can we forecast our future demand?
WGA’s Power BI Portfolio reporting capabilities can answer these questions and more. We understand portfolio resource management and what it entails. We have the expertise to help our clients here.
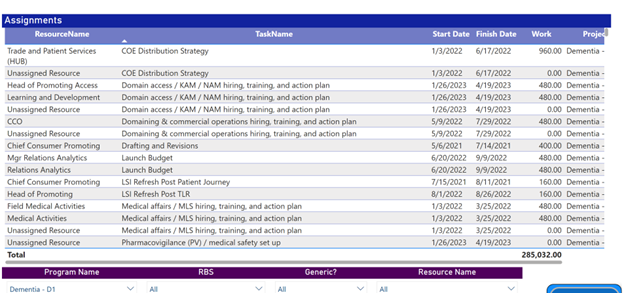
Resource Project Assignments
In the following Power BI page, we see the assignments of a selected set of resources and programs helping program managers, resource managers, and staff plan for the upcoming work.
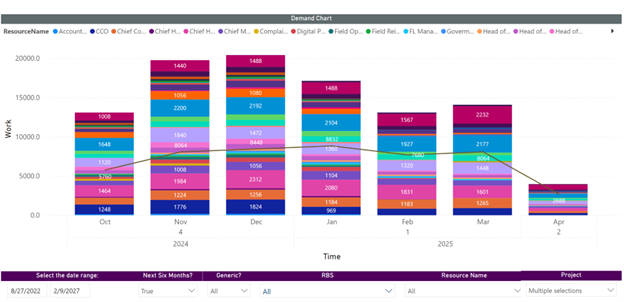
Resource Demand Forecast
The actual capacity vs work comparison is critical for understanding where resources are overbooked and so adjustments can be made. The page below shows a demand column chart for a filtered set of resources over time. Overallocations can be easily identified with this.
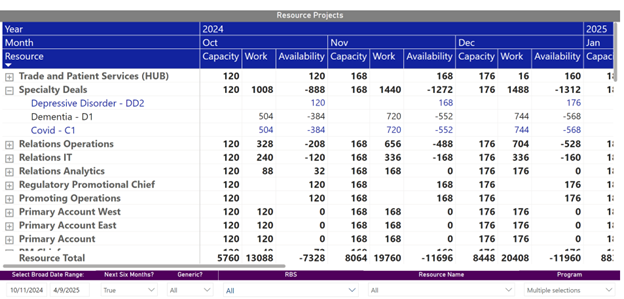
Resource Programs Capacity Table
Dropping down to a lower level, we can display this same demand information in a table sliced by resource and then by program so detailed adjustments can be determined and made.
* This same work information can also be calculated in terms of cost by adding rates to the resources in the system.